Happy Mapping Monday! Today’s #mappingmondays video shows the next part of the series of how we can use Wardley Mapping to map out unique attributes as part of April Dunford’s Product Positioning Framework from the book Obviously Awesome. If you’re interested in finding out how to apply this to your organization, don’t hesitate to reach out via Twitter or email hello at coryfoy dot com!
Links:
Transcript:
Happy Monday! I’m Cory Foy, and welcome to Mapping Mondays! This week’s video continues a several week series on mapping strategic advantage by combining Wardley Maps and April Dunford’s Product Positioning framework from the book Obviously Awesome to show how we can map out Unique Attributes of our product.
Last week, I presented a value chain map for a company that provides a bug tracking tool. The first step in Dunford’s framework is listing competitive alternatives – what your customer would do if they didn’t have your product. We compared it to a shared online spreadsheet, showing how we could think about competitive alternatives by considering what happens when components were in different stages.
What didn’t change was the components between the two options. That’s partly because we approached it from a high level view – for example, “Data Store” meant an actual database for our application but the spreadsheet itself for the alternative.
But for this next step in the product positioning steps, we want to dive deeper and look at Unique Attributes. These are capabilities or features that our offering has that the competitive alternatives do not. And one of the best ways to do that is visualizing it on a graph!
Let’s look at that value chain map again, but focus on the core proposition of a bug tracking app – tracking bugs! What we want to add to this graph is what makes us unique. Of course, we don’t know what makes us unique until we’re compared to our alternative, so let’s start with adding in how we accomplish these things – what we think makes us unique.
For example, to collect Bug Information, we have a standard Bug Entry Form. We also have an API that people can use to create bugs in the system. Finally, we have integrations with several market leading tools to create bug tracking items in our system when those source systems detect errors.
For timing information, users can manually update the fields in the system, or we can automatically update them when certain actions happen, either in our system or through our integrations.
Bug Status can likewise be manually updated. Or we have integrations with source control providers that allow us to update the status based on the acceptance of a Pull Request, or even a Pull Request with successful passing tests.
Taken together this starts to paint a broader picture of how we stack up against a simple spreadsheet. But let’s actually look at our unique attributes by doing this exercise with our competitive alternative.
With a spreadsheet, we capture bug information by filling out columns. Most online spreadsheets have an API you can also use to write to cells, so that’s an option.
Timing information can also be updated manually or in an automated fashion using formula triggers.
Finally, Bug Status can of course be manually updated by changing a column, or via an API.
If we overlay these, we start to get a picture of our unique attributes.
Clearly our application integrations win out here – whether it’s creating bugs, updating timing information, or being able to update bugs based on code changes. But does this seem right? Certainly we have stronger unique attributes in the other areas, right?
And, in fact, we do. Dunford says that the unique attributes are often technical features, but can also be things like your delivery model, business model, or specific expertise. And I’d add one more – your evolution of components.
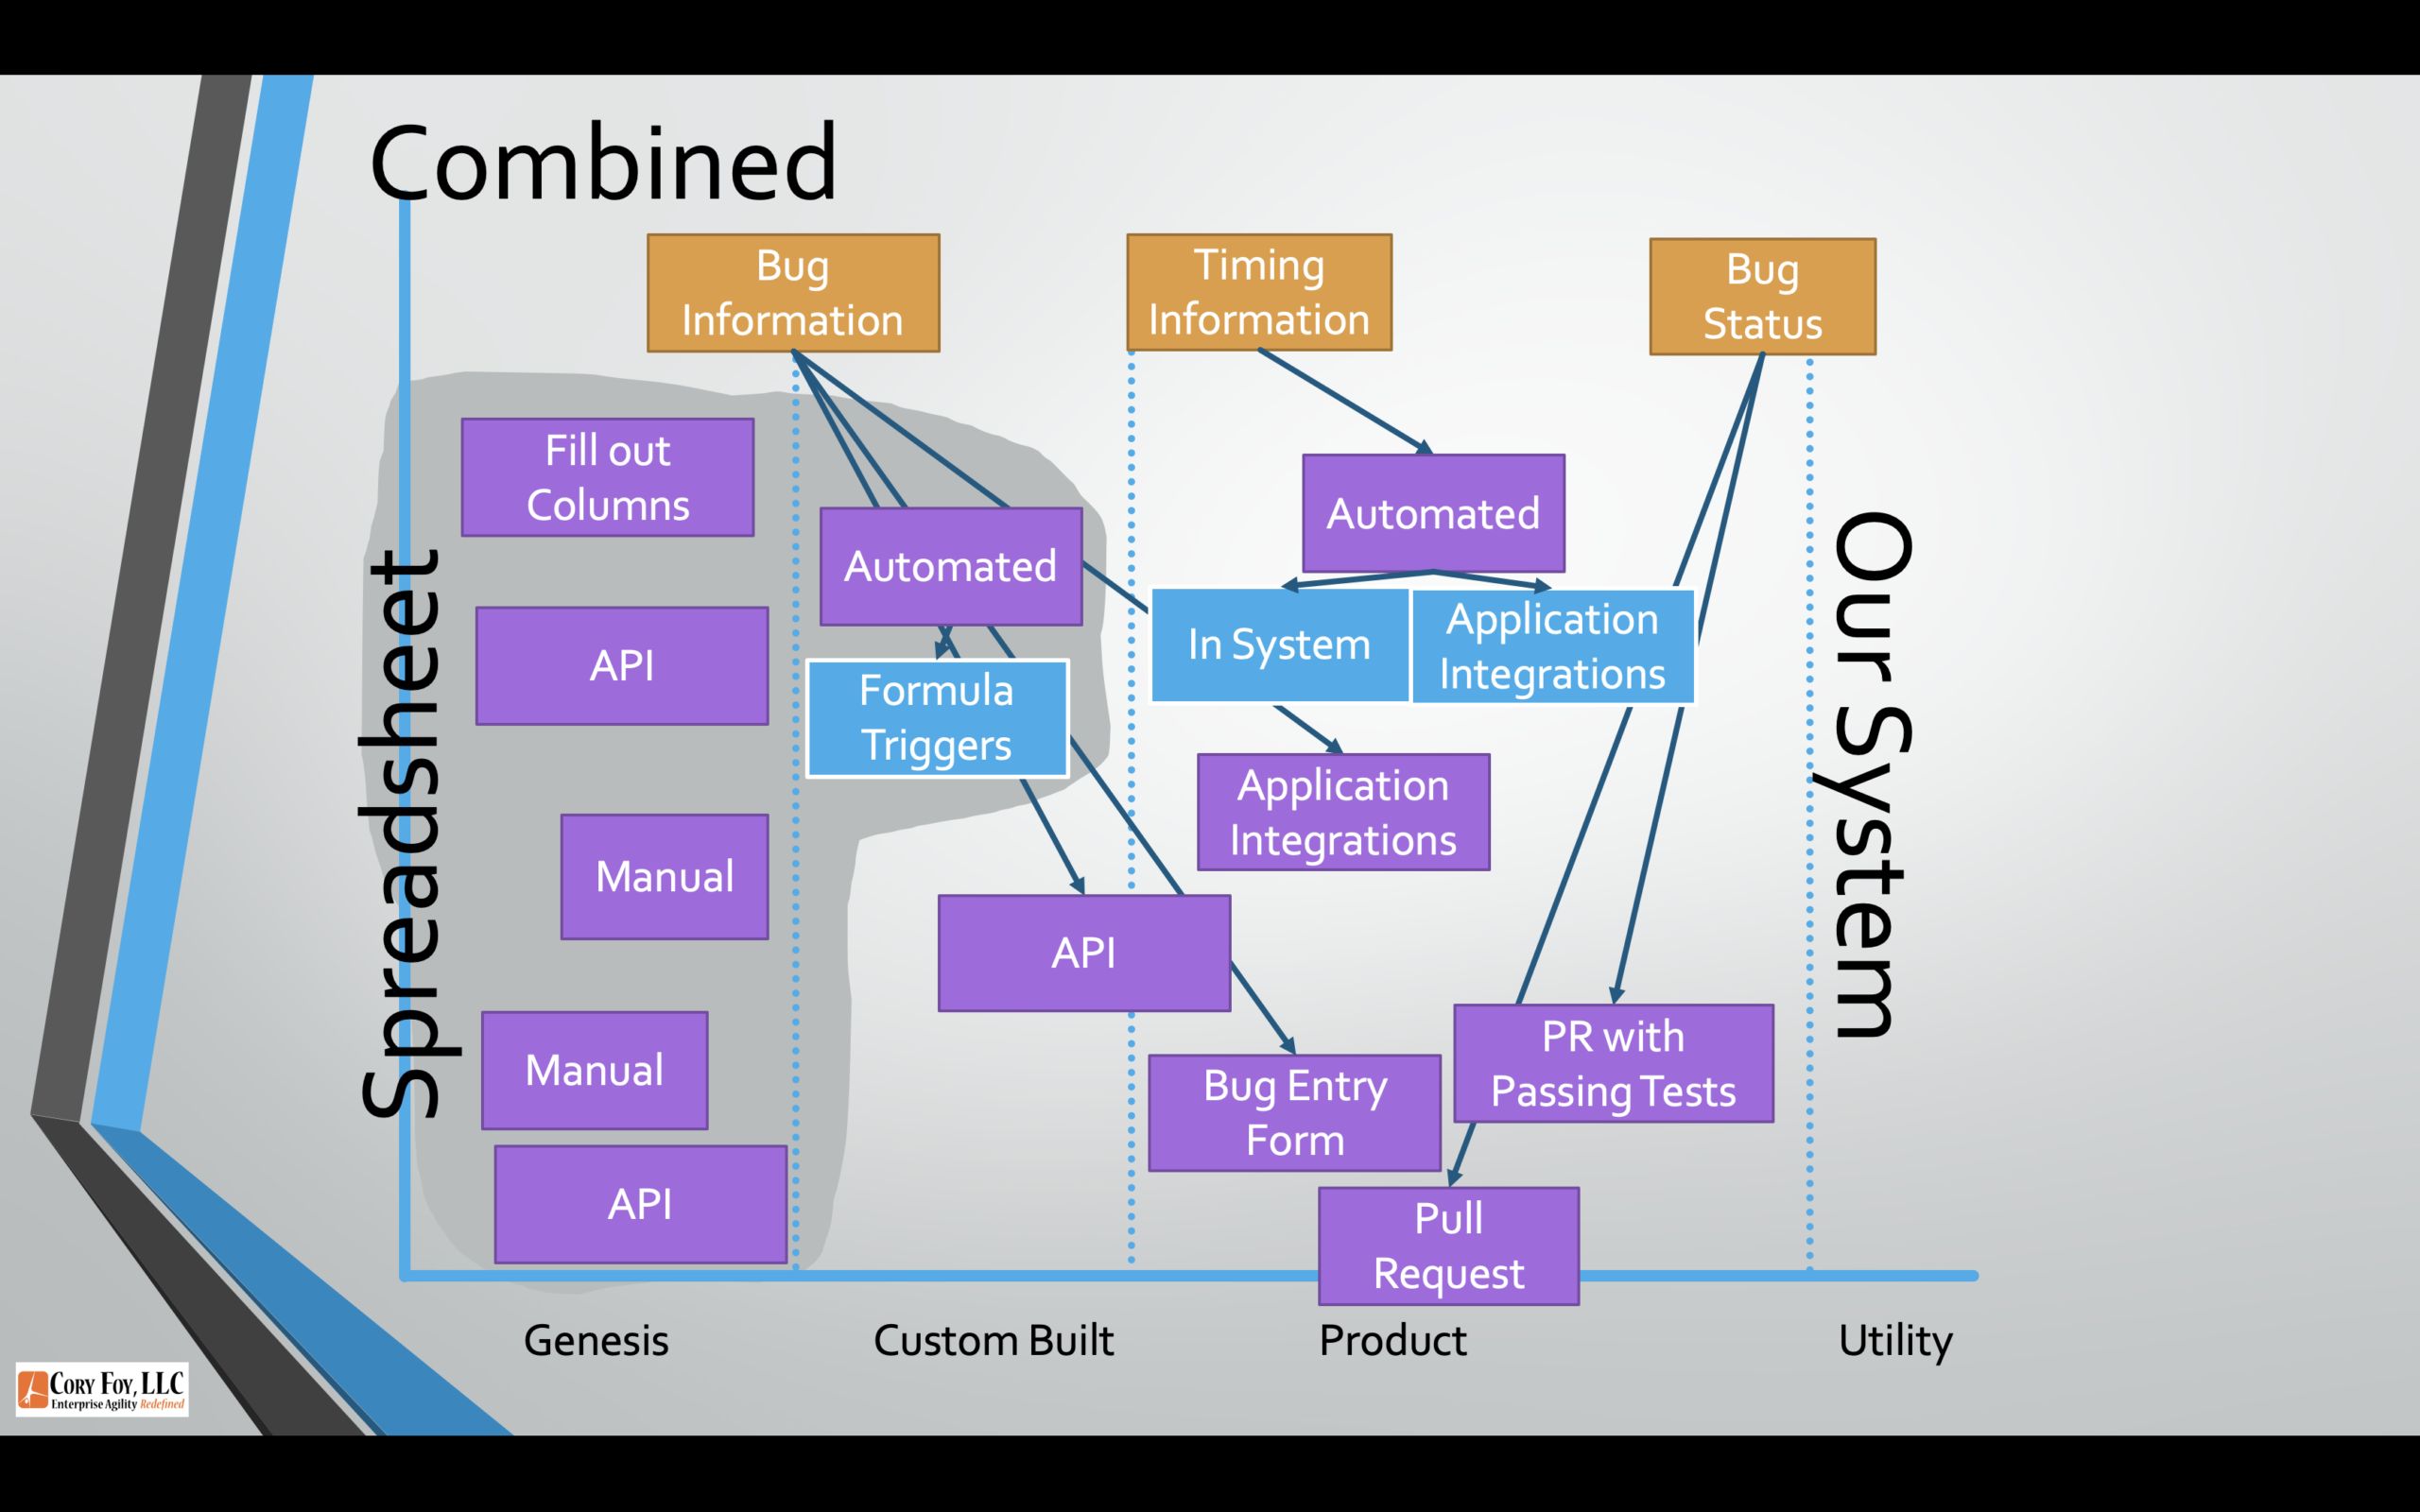
Let’s go back and turn the value chain map of our system into a Wardley Map. We can see that many attributes of it – even the API – are products. This means customers can build components on top of our API because it’s providing an interface into the key steps into our system.
Now, let’s look at the Spreadsheet. Here we can see that, while it does have an API, you’re going to be manipulating cells, not managing bugs. This means that the API is really more in the Genesis / Custom Build edge – in order to make it useful you’re going to have to build your own abstractions on top of it.
Combining these we can see that an additional unique attribute we have is one of maturity – we have a more evolved view of the market and needs for our customer’s needs. And they can build custom integrations more easily when they do need to do that.
So when you’re working to determine your unique attributes, being able to compare value chain graphs can produce some key insights, but mapping those components can expose additional unique attributes that go beyond your features to your approaches and advances.
Hope you’ve enjoyed this video! As a reminder I offer free consulting sessions if you want to get started in mapping, and work with organizations across the globe helping them understand and improve their processes and strategies. If you’d like to set up a call, don’t hesitate to reach out on Twitter at @cory_foy or via email at hello at coryfoy dot com. Until next week, may you find and celebrate those attributes that make you unique!
