Happy Mapping Monday! Today’s #mappingmondays video starts a new series on using April Dunford’s Production Positioning Framework with Simon Wardley’s Wardley Maps. We start today with Competitive Alternatives. If you’re interested in finding out how to apply this to your organization, don’t hesitate to reach out via Twitter or email hello at coryfoy dot com!
Links:
Transcript:
Happy Monday! I’m Cory Foy, and this week’s video starts a couple week series on using maps to evaluate strategic advantage. Recently I’ve been reading the book Obviously Awesome by April Dunford, who lists out five + one components of effective Product Positioning: Competitive Alternatives, Unique Attributes, Value (and proof), Target Market Characteristics, Market Category, Relevant Trends. While some of these are focused on more traditional market research, there’s a lot we can use Wardley Maps for to help us dig in. Let’s start with competitive alternatives. Dunford defines this as what our target customers would use or do if our product didn’t exist. What’s great about that is this definition lends itself very well to Value Chain Maps.
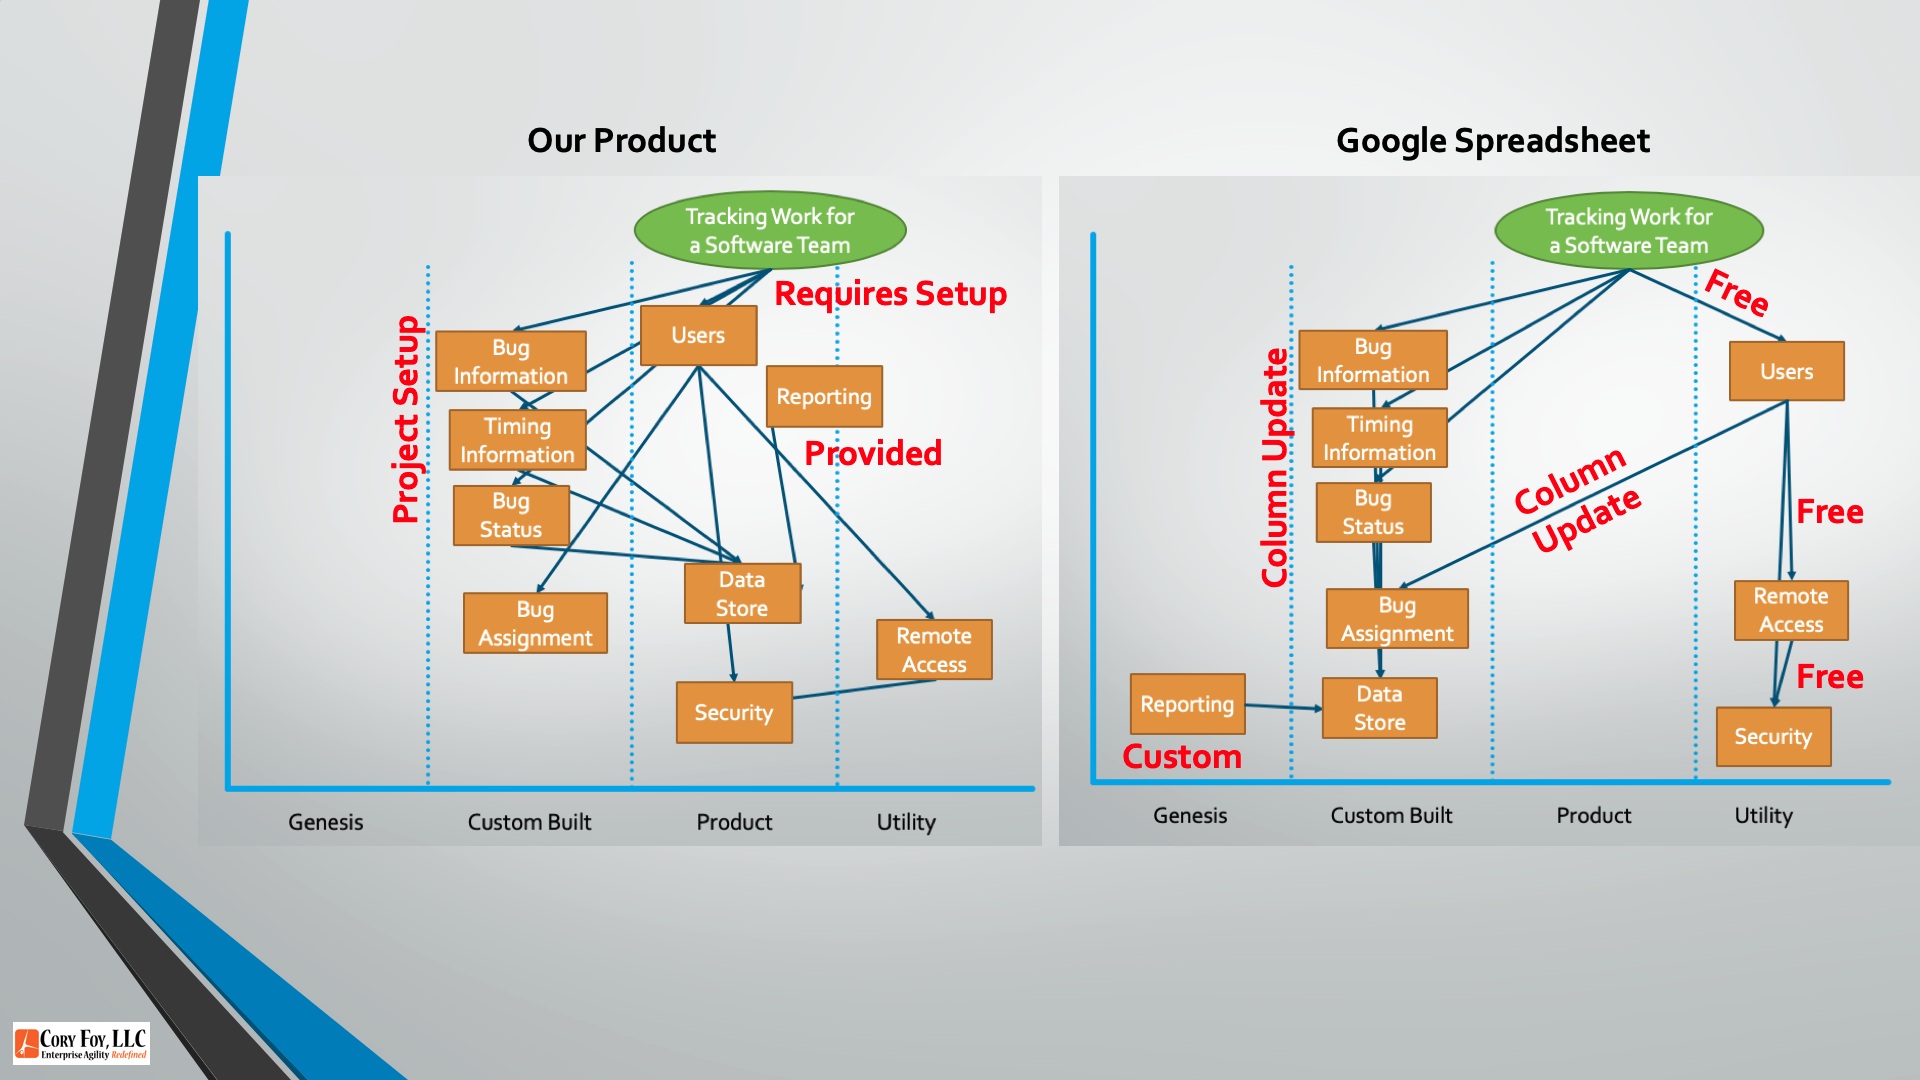
Let’s imagine we’re a software company that provides a bug tracking tool. So we start with a user need of tracking work for a software team. Looking at the components we need to do that, we have users, bug information, timing information, and bug status. These rely on a data store, which is also a dependency of reporting. We also have the notion of remote access and an implied security model. We may also have assignment of bugs to users. If we map these components, several end up in the Product or Utility stage. What Dunford asks us to do is think about how else customers would solve this problem without our product. And one interesting way to do that is to think about the solutions if those components were in Genesis / Custom Built.
In that context, we still have users, bug information, timing information and bug status, relying on a data store, with reporting and assignment. But instead of our tool, customers use a shared spreadsheet. Especially with something like integrated Google Apps, you get users and security (from the company’s domain users), Bug Information (a column), timing information (also a column, though maybe with a formula auto-updating), bug status (a column with fixed choices), remote access (it’s a Google Doc) and even assignment (a column). The primary weakness would be in reporting.
Comparing the maps, we can put some cost / timing estimates on here. For example, setting up users is free for the Google Docs case, but will require work in our application, unless we integrate as a Single-Sign on Provider. Typically bug tracking tools require setting up projects, bug definitions, and user access, all which take time. Worse, the cost of change for a bug definition might be higher in our application if we have to deal with ensuring historical data doesn’t change.
So, we have some challenges. As Dunford says in her book “but if the real alternative in the mind of a customer is Excel, you can’t say your product is easier to use unless it is easier to use than a spreadsheet.” By mapping out the user needs and thinking about de-evolution we were able to map some alternatives we don’t traditionally think about, which means we have to think carefully about what differentiates us as well our positioning. We’ll spend some more time on that next week when we talk about unique attributes.
Hope you found this week’s video useful! If you’re trying to figure out the best way to get started with mapping or applying strategic thinking with maps, don’t hesitate to reach out on Twitter at @cory_foy or via email at hello at Cory Foy dot com. And I’ve included a link to Dunford’s book in the blog post for this video. Until next week, happy mapping!
