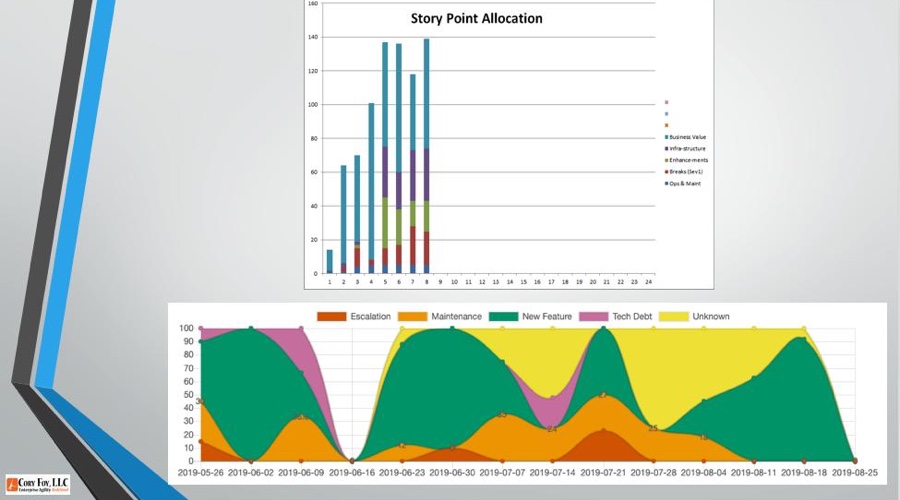
Happy Friday! This week’s #fasterfridays is a great watch if you have hidden work in your teams. We talk about using story points – as opposed to hours – to generate insights across some different categories of work. If you’re interested in finding out how to apply this to your organization, don’t hesitate to reach out via Twitter or email hello at coryfoy dot com. Have a great weekend!
Transcript:
Happy Friday, and welcome to another edition of FASTER Fridays! One of the insights I like to help organizations with is an understanding of how they spend their time. But there’s a catch – measuring how people spend their time is itself an activity, and if done in too much detail, or with too much burden, can cause its own set of problems.
To solve this, I use something with a lot of information already out there – story points! I really like them because after the initial figuring out of how they work, teams can run with them. Unlike how story points are taught, I want teams to try story pointing lots of activities – not just user stories.
As an example, let’s say we think we’re spending a lot of time on maintenance activities or paying off technical debt. We would put a card in whatever tracking system we’re using – from Jira to Post-It Notes, and size it like any other work. We can then see the balance of feature work to maintenance work to see if we’re investing properly.
I also like using them for bugs, defects and escalations. Traditionally these are trickier because it’s hard to know up front how long it will take. So what should we do? Post-size! That’s right – I’m not trying to get teams to be clairvoyant – instead trying to get them insights they may not have.
Combined together, we can generate pictures of how teams spend their time. And across clients I tend to find interesting correlations between teams which have a healthy balance of maintenance work and feature work – when that investment is skewed towards feature work, we tend to see time spent in escalations and defect resolution rise.
But that’s not the only picture we can tell. Sometimes it’s not about the mix of work, but about the types of activities highlighting organizational or tool gaps. This graph shows similar point tracking, but categorized into value work – which would be feature, maintenance, tech debt – and enablement work – in this case, work setting up environments for deployment, manually testing deployments, etc. What we found is that the lack of a staging environment was costing this company around $2mm a quarter in enablement work when they did their deploys. We were able to use these insights for cost justification for a new staging environment, and also were able to show the associated drop in costs once it went online.
Finally, I’ve been asked before about why not simply use hours and time tracking. There’s two reasons for that. The first is that it can be a burden to collect at that level, especially for teams. But the bigger reason is that I often work hard to keep executives from wanting all estimates in hours and Gantt charts. If we switch back to hours-based estimates and tracking, even for something like this, it says that points and relative sizing are not good enough for “real work†and can end up with them totally ignored.
So if your teams seem to have lots of ancillary work stealing time from what they want to be doing, try capturing and sizing it, and then looking at the aggregate numbers. You might find some really interesting insights that open the doors for adjustments and improvements in the way you work.
Hope you’ve enjoyed this. Feel free to check out all of the FASTER Friday videos on my blog, and if you’d like more information do reach out on Twitter at @Cory_foy or via email at hello at coryfoy dot com. And be sure to come back next Friday for another Faster Fridays video!
